NCBI Logo   NCBI » UniGene » EST Profile Viewer
Pubmed Nucleotide Protein Genome Structure Popset Taxonomy
 
 Search  

EST Profile

Hs.632032 - Transcribed locus, moderately similar to NP_496375.1 Ribosomal Protein, Large subunit family member (rpl-41) [Caenorhabditis elegans]

Breakdown by Body Sites

   Hs.632032
adipose tissue 0 0 / 13156
adrenal gland 0 0 / 33329
ascites 0 0 / 40070
bladder 0 0 / 30143
blood 0 0 / 124121
bone 0 0 / 71802
bone marrow 0 0 / 49157
brain 0 0 / 1104455
cervix 0 0 / 48504
connective tissue 0 0 / 149632
ear 0 0 / 16344
embryonic tissue 4 1 / 215843
esophagus 0 0 / 20208
eye 0 0 / 211776
heart 0 0 / 90359
intestine 0 0 / 235519
kidney 0 0 / 212612
larynx 0 0 / 24478
liver 0 0 / 208412
lung 0 0 / 338155
lymph 0 0 / 44400
lymph node 0 0 / 91917
mammary gland 0 0 / 154387
mouth 0 0 / 67229
muscle 0 0 / 108212
nerve 0 0 / 15815
ovary 0 0 / 102660
pancreas 0 0 / 215322
parathyroid 0 0 / 20643
pharynx 0 0 / 41502
pituitary gland 0 0 / 16736
placenta 0 0 / 284142
prostate 0 0 / 190888
salivary gland 0 0 / 20291
skin 0 0 / 211668
spleen 0 0 / 54070
stomach 10 1 / 97199
testis 3 1 / 331421
thymus 0 0 / 81245
thyroid 0 0 / 47956
tonsil 0 0 / 17043
trachea 0 0 / 52435
umbilical cord 0 0 / 13768
uterus 0 0 / 233995
vascular 0 0 / 51949


Breakdown by Health State

   Hs.632032
adrenal tumor 0 0 / 12852
bladder carcinoma 0 0 / 17775
breast (mammary gland) tumor 0 0 / 94613
cervical tumor 0 0 / 34597
chondrosarcoma 0 0 / 82863
colorectal tumor 0 0 / 114995
esophageal tumor 0 0 / 17290
gastrointestinal tumor 0 0 / 119873
germ cell tumor 3 1 / 264762
glioma 0 0 / 107520
head and neck tumor 0 0 / 137408
kidney tumor 0 0 / 69407
leukemia 0 0 / 96603
liver tumor 0 0 / 96673
lung tumor 0 0 / 103492
lymphoma 0 0 / 72056
non-neoplasia 0 0 / 97517
normal 0 3 / 3376022
ovarian tumor 0 0 / 77223
pancreatic tumor 0 0 / 104978
primitive neuroectodermal tumor... 0 0 / 126477
prostate cancer 0 0 / 103894
retinoblastoma 0 0 / 46536
skin tumor 0 0 / 125588
soft tissue/muscle tissue tumor 0 0 / 125930
uterine tumor 0 0 / 90827


Breakdown by Developmental Stage

   Hs.632032
embryoid body 0 0 / 70776
blastocyst 0 0 / 62346
fetus 0 0 / 567973
neonate 0 0 / 31178
infant 0 0 / 23671
juvenile 0 0 / 55766
adult 1 2 / 1953255


EST profiles show approximate gene expression patterns as inferred from EST counts and the cDNA library sources (as reported by sequence submitters). Libraries known to be normalized, subtracted, or otherwise biased have been removed, but for a variety of reasons, EST counts may not be a true indication of gene activity.
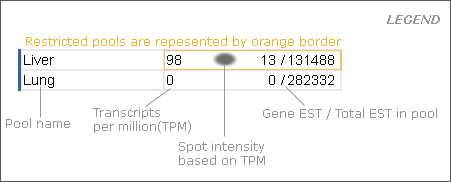

figure legend


Questions or Comments?
 E-mail the NCBI Help Desk
firstgov logo
National Center for Biotechnology Information
U.S. National Library of Medicine
National Institutes of Health
DHHS logo
Disclaimer |Freedom of Information Act  |  Privacy Policy