NCBI Logo   NCBI » UniGene » EST Profile Viewer
Pubmed Nucleotide Protein Genome Structure Popset Taxonomy
 
 Search  

EST Profile

Hs.61441 - RBM27: RNA binding motif protein 27, mRNA (cDNA clone IMAGE:3458303)

Breakdown by Body Sites

   Hs.61441
adipose tissue 76 1 / 13156
adrenal gland 30 1 / 33329
ascites 0 0 / 40070
bladder 66 2 / 30142
blood 40 5 / 124114
bone 55 4 / 71801
bone marrow 20 1 / 49155
brain 11 13 / 1104442
cervix 20 1 / 48501
connective tissue 13 2 / 149631
ear 61 1 / 16344
embryonic tissue 13 3 / 215840
esophagus 0 0 / 20208
eye 14 3 / 211776
heart 22 2 / 90357
intestine 38 9 / 235516
kidney 61 13 / 212611
larynx 163 4 / 24477
liver 9 2 / 208415
lung 47 16 / 338153
lymph 45 2 / 44400
lymph node 97 9 / 91913
mammary gland 12 2 / 154379
mouth 14 1 / 67229
muscle 9 1 / 108211
nerve 0 0 / 15815
ovary 38 4 / 102657
pancreas 0 0 / 215318
parathyroid 48 1 / 20643
pharynx 0 0 / 41502
pituitary gland 59 1 / 16735
placenta 24 7 / 284137
prostate 57 11 / 190886
salivary gland 0 0 / 20290
skin 9 2 / 211651
spleen 0 0 / 54070
stomach 0 0 / 97197
testis 39 13 / 331428
thymus 0 0 / 81246
thyroid 20 1 / 47956
tonsil 0 0 / 17044
trachea 0 0 / 52436
umbilical cord 0 0 / 13768
uterus 94 22 / 233990
vascular 19 1 / 51946


Breakdown by Health State

   Hs.61441
adrenal tumor 0 0 / 12852
bladder carcinoma 56 1 / 17772
breast (mammary gland) tumor 10 1 / 94609
cervical tumor 28 1 / 34596
chondrosarcoma 24 2 / 82863
colorectal tumor 34 4 / 114992
esophageal tumor 0 0 / 17290
gastrointestinal tumor 16 2 / 119870
germ cell tumor 0 0 / 264754
glioma 0 0 / 107520
head and neck tumor 50 7 / 137406
kidney tumor 28 2 / 69409
leukemia 51 5 / 96598
liver tumor 0 0 / 96674
lung tumor 38 4 / 103492
lymphoma 41 3 / 72055
non-neoplasia 0 0 / 97517
normal 25 87 / 3375973
ovarian tumor 38 3 / 77223
pancreatic tumor 0 0 / 104977
primitive neuroectodermal tumor... 39 5 / 126471
prostate cancer 57 6 / 103891
retinoblastoma 21 1 / 46537
skin tumor 15 2 / 125579
soft tissue/muscle tissue tumor 39 5 / 125928
uterine tumor 88 8 / 90826


Breakdown by Developmental Stage

   Hs.61441
embryoid body 28 2 / 70775
blastocyst 0 0 / 62345
fetus 24 14 / 567971
neonate 0 0 / 31178
infant 0 0 / 23670
juvenile 0 0 / 55764
adult 32 64 / 1953217


EST profiles show approximate gene expression patterns as inferred from EST counts and the cDNA library sources (as reported by sequence submitters). Libraries known to be normalized, subtracted, or otherwise biased have been removed, but for a variety of reasons, EST counts may not be a true indication of gene activity.
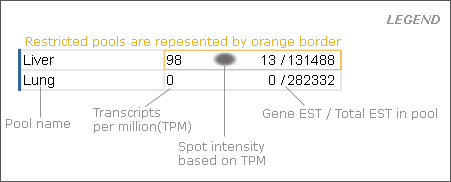

figure legend


Questions or Comments?
 E-mail the NCBI Help Desk
firstgov logo
National Center for Biotechnology Information
U.S. National Library of Medicine
National Institutes of Health
DHHS logo
Disclaimer |Freedom of Information Act  |  Privacy Policy